One Clear Picture
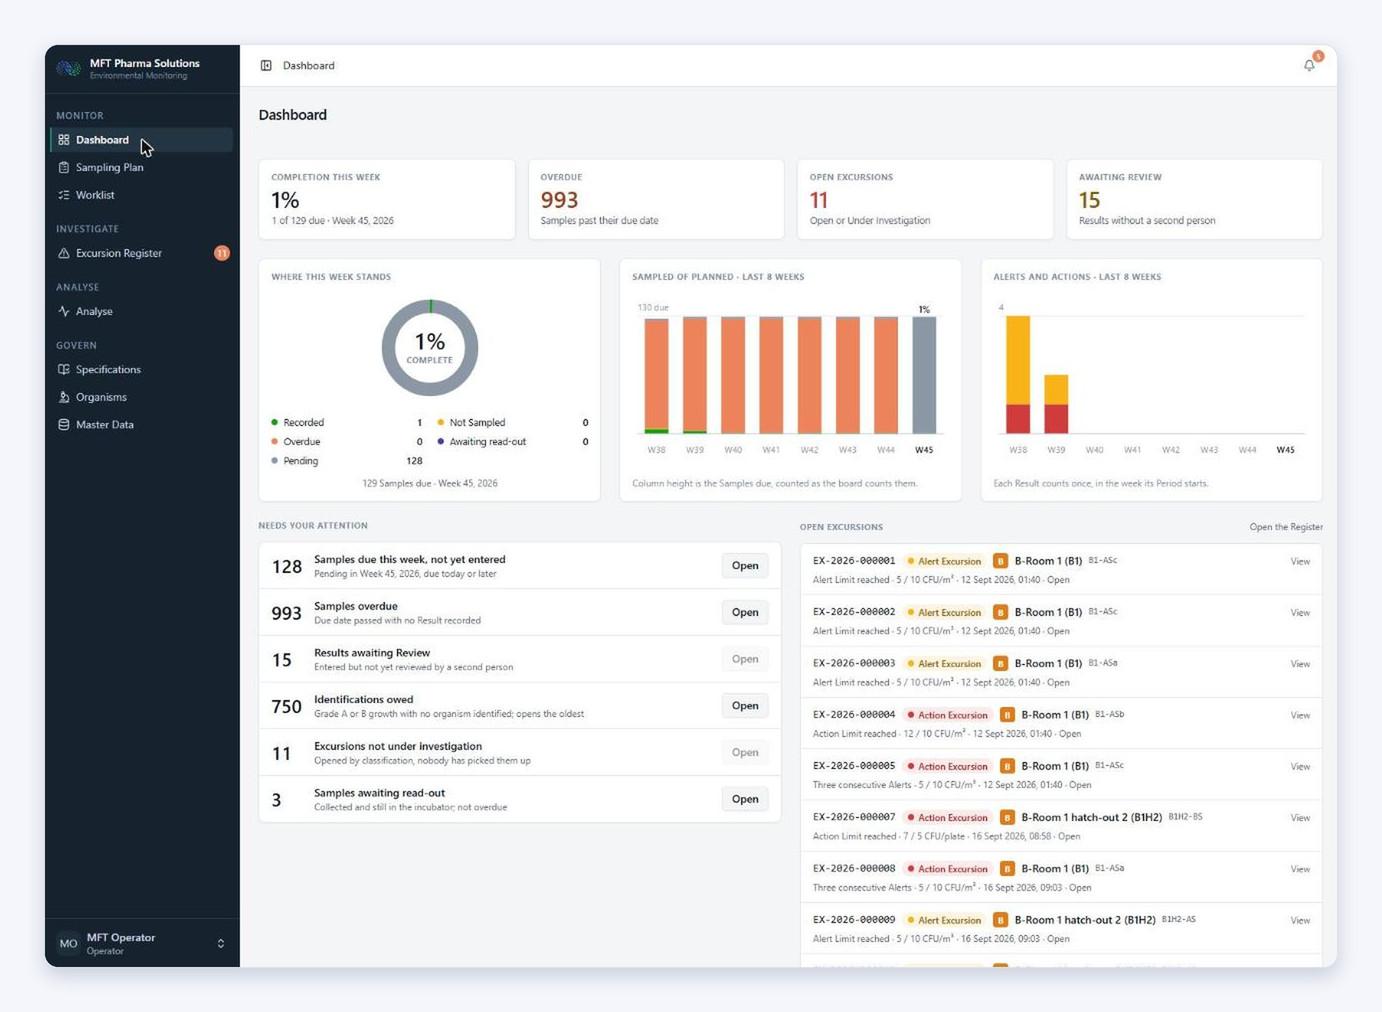
What is due, what is overdue and what is out of limits, on one screen.

The Hauge, Netherlands
+31 623199567
info@mftconsult.nl








Environmental Monitoring decides whether a batch is released, whether an investigation is credible and how an inspection goes. In most facilities it still runs on spreadsheets, and the people who depend on it cannot see the state of their own cleanrooms without asking someone. We change that: one governed system, configured around your facility, that shows you where you stand today.
What is due, what is overdue and what is out of limits, on one screen.
Trends and repeat hits surface while they are still cheap to fix.
Every number traceable to who recorded it, when, and against which limit.
From workbooks to a validated system in six stages. Data integrity, access control and an audit trail run through every one of them.
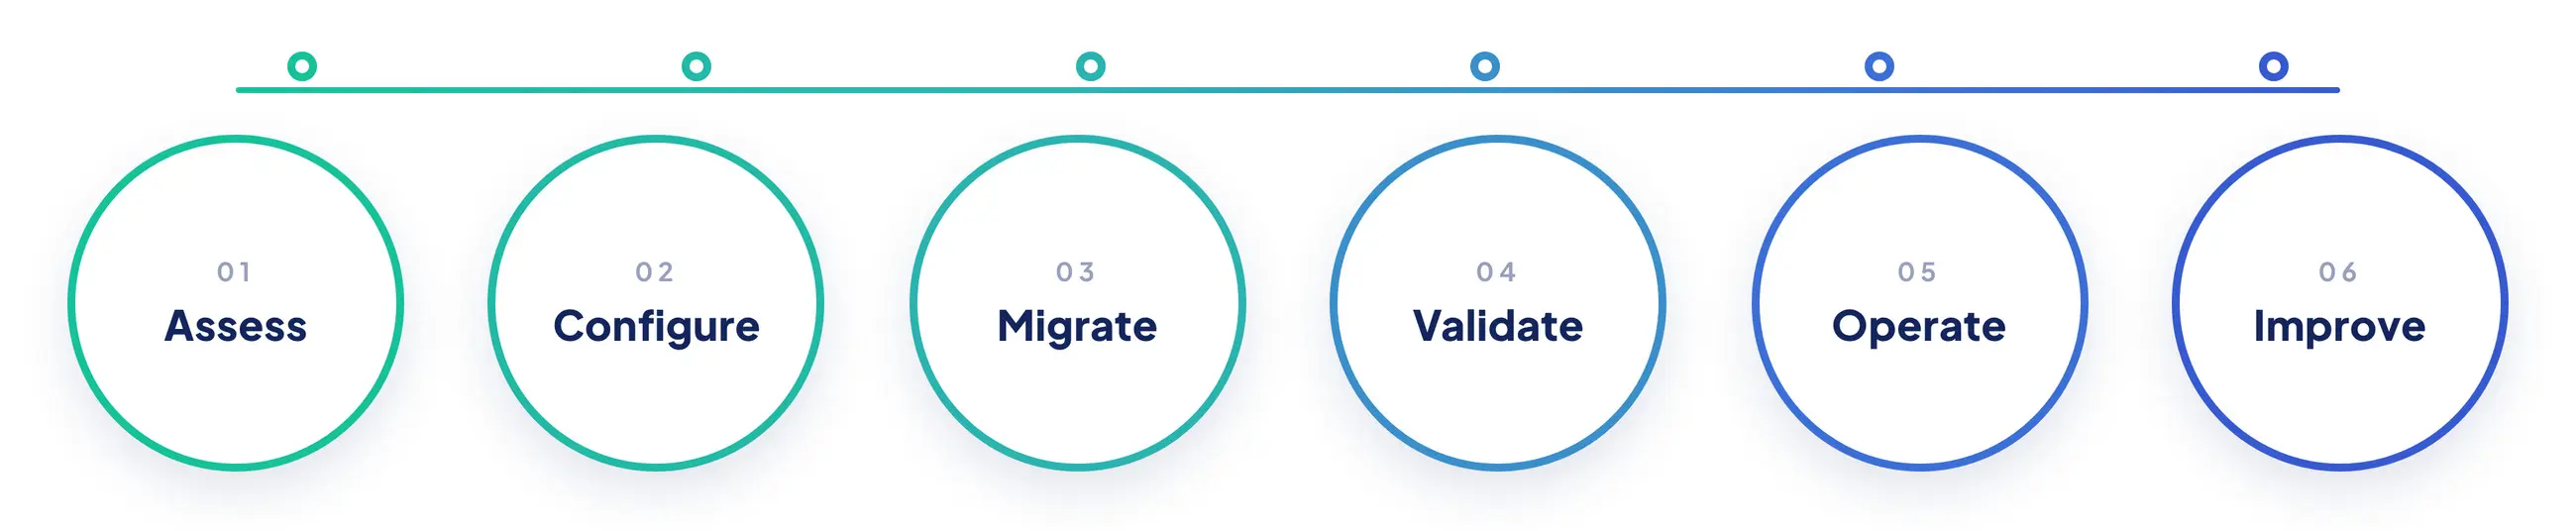
Data integrity · access control · audit trail across every stage
It is rarely the monitoring itself. It is the workbook only one colleague fully understands, the limit that was updated in one file but not another, the sample nobody noticed was missed, and the week of copy-paste before every periodic review. None of that shows up until an auditor asks, or until a contamination event has to be explained. Digitalization removes those gaps rather than adding another system on top of them.
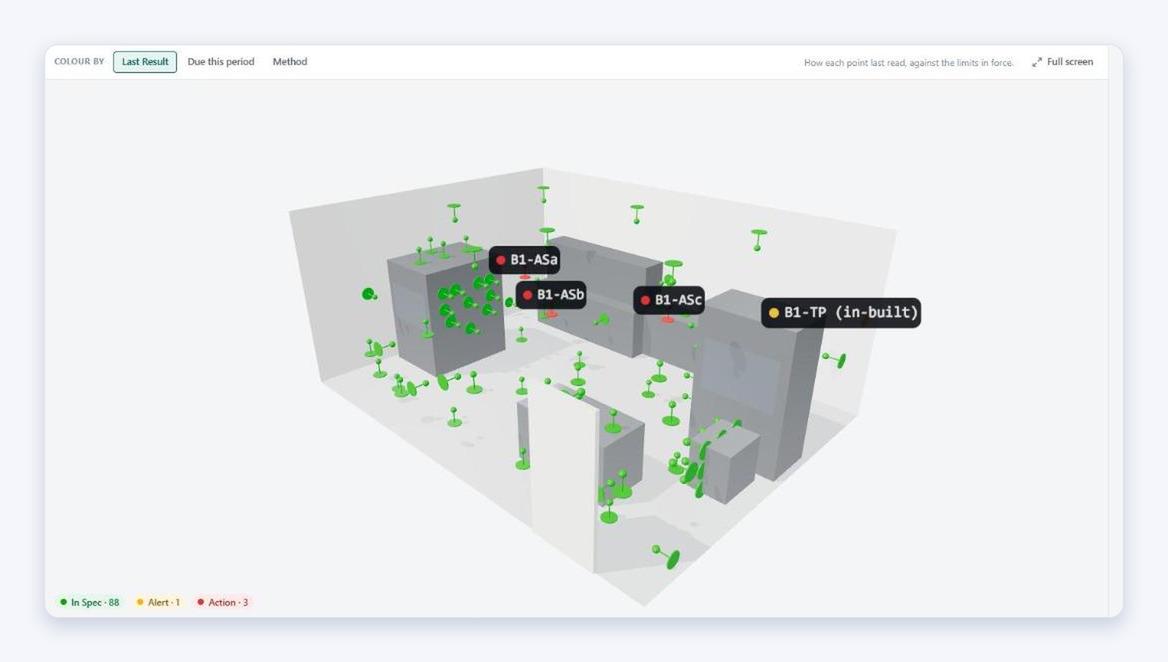
Every sampling point sits in a model of the actual room, coloured by its latest result: green in specification, amber Alert, red Action. In one look you can tell whether the hits are scattered across the suite or clustered around one bench, one hatch or one door — the question every contamination investigation has to answer, and the one a table of numbers answers slowly. The same room can be coloured by what is due this period, which turns the weekly plan into a picture instead of a checklist. Placements come from your own point codes, so the model follows your qualified layout without a separate drawing exercise.
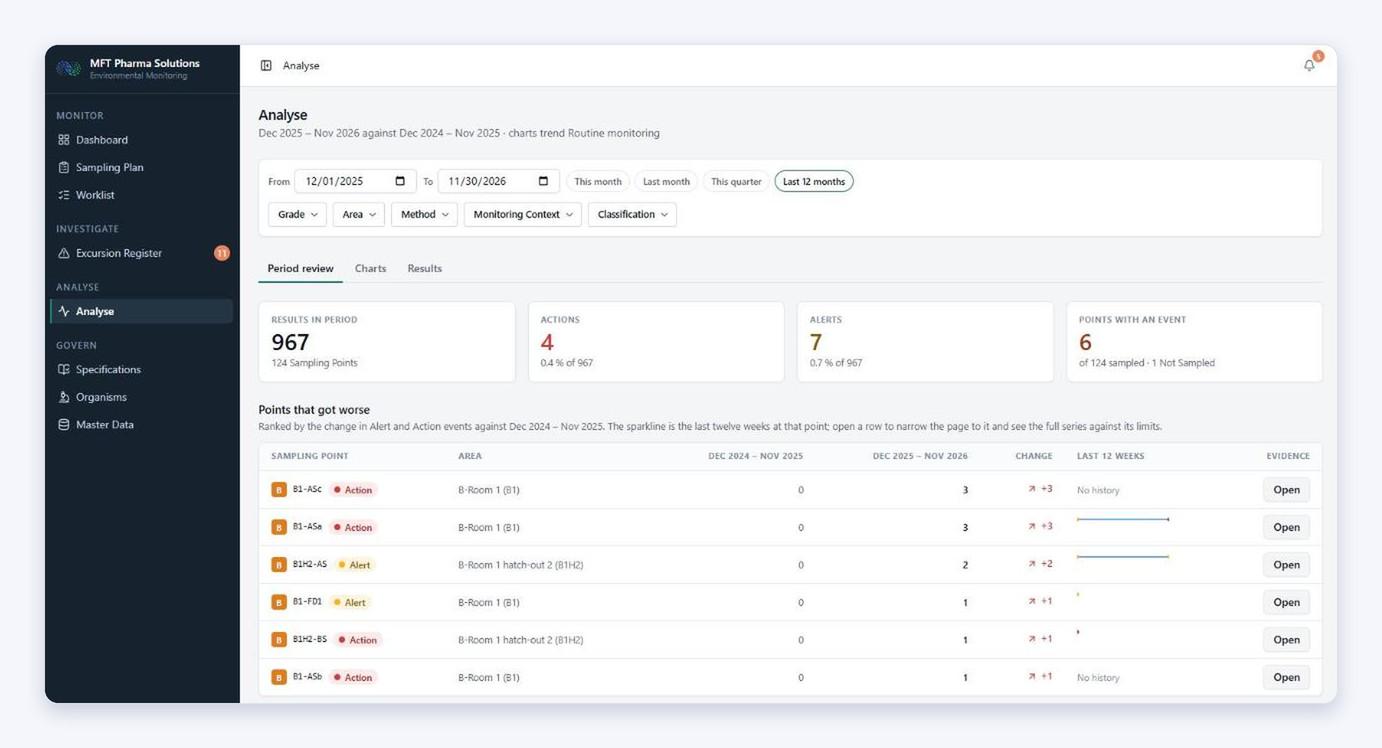
Trending is where spreadsheets cost the most time and deliver the least insight. Here it is always on: the system ranks the points that got worse against the same period last year, shows the last twelve weeks as a sparkline beside each one, and flags any point sitting on its second consecutive Alert — the one before a third Alert becomes an Action. That is the moment when cleaning, gowning or airflow can still be corrected quietly, instead of being investigated publicly.
For periodic quality review, the same data produces events per area, classification over time and recovery-rate movement without anyone rebuilding a workbook. What used to take a week before each review is ready when you open the page.
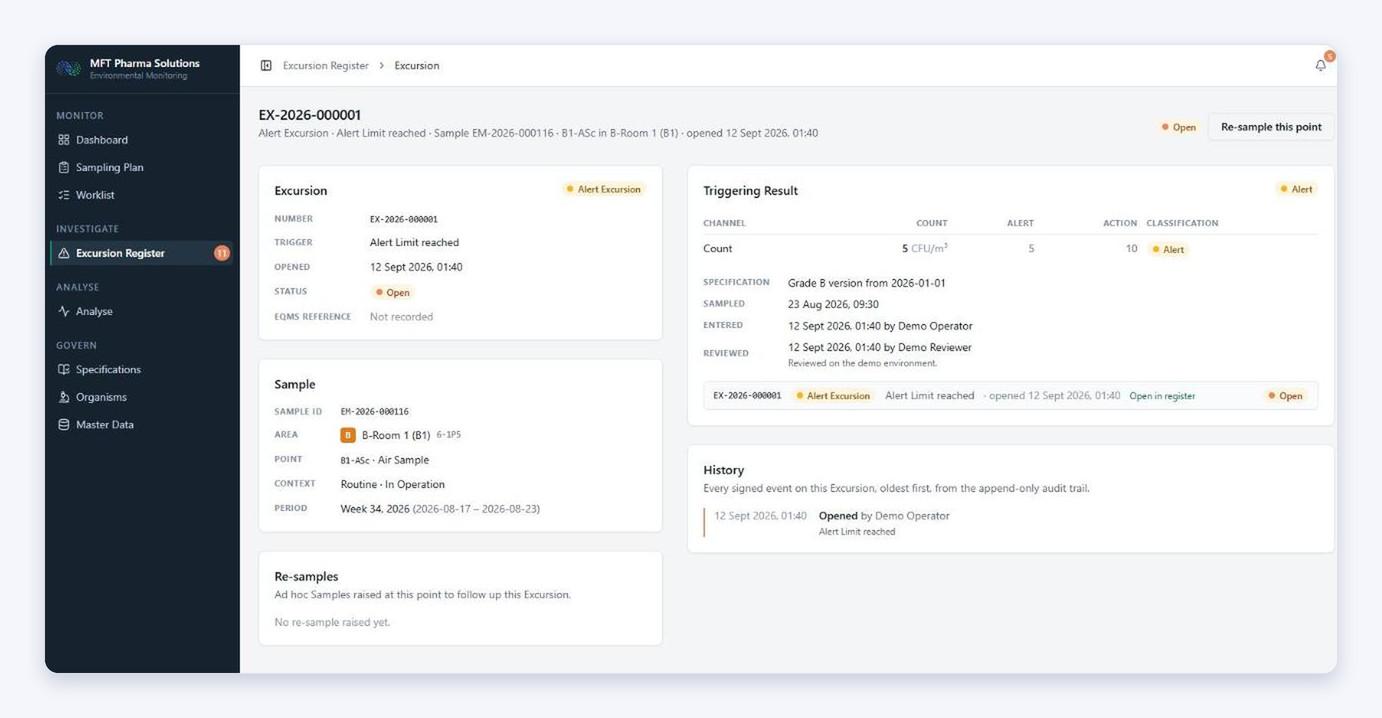
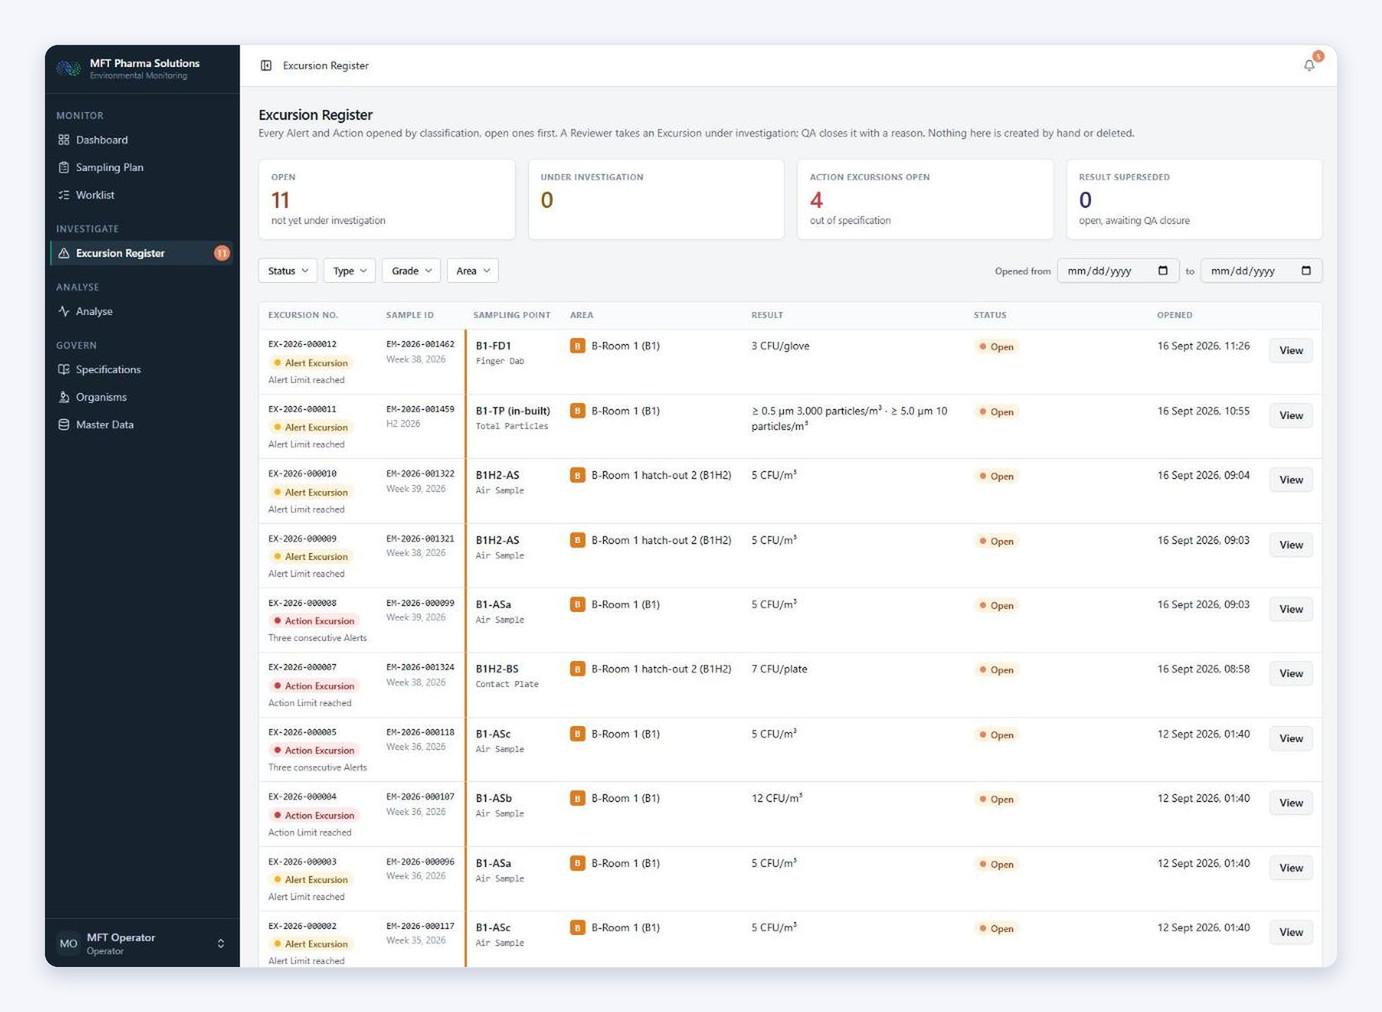
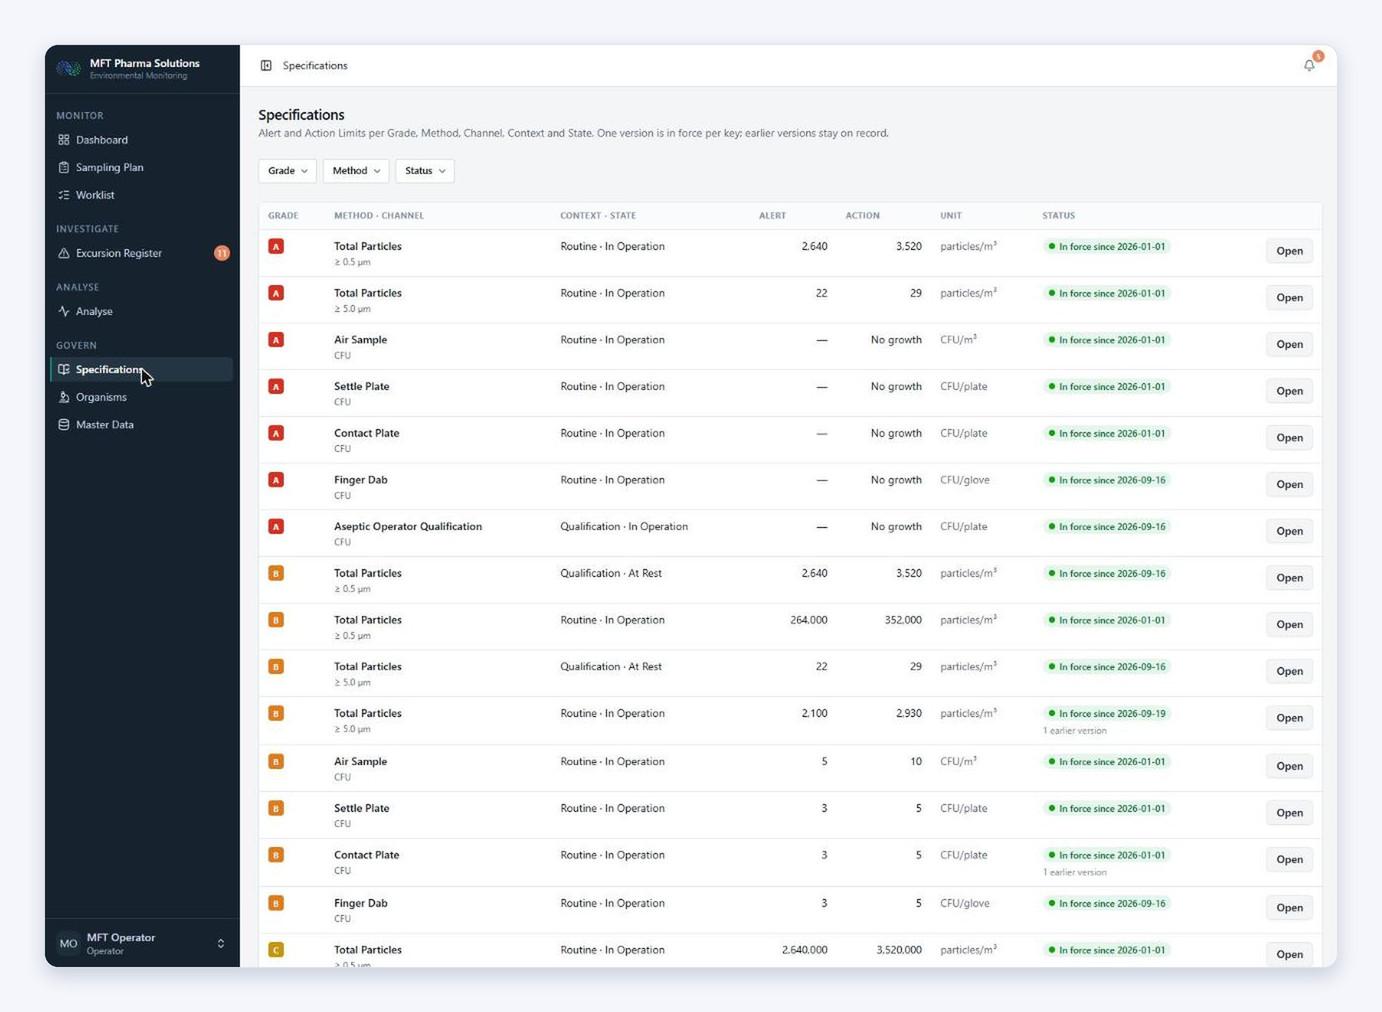
Nothing is left to someone remembering. The moment a result is entered, it is classified against the specification that was in force on the sample date, and an excursion is opened automatically — for a single Action result, for an Alert, and for the third consecutive Alert at the same point. Mould or swarming overrides the count. A sample that was not taken is recorded as not sampled with a reason, never quietly as a pass.
From there the record carries itself: the triggering result and the limits it was judged against, who entered it, who reviewed it as a second person, the investigation, root cause, CAPA and effectiveness check, and an append-only history of every signed event. Nothing in the register is created by hand and nothing is deleted.
Environmental Monitoring is where most companies start, because the regulatory expectations are the clearest and the pain is the most obvious. The method is not specific to it. We map the process you already run, turn it into configurable master data, rebuild it as a governed workflow with the right approvals, and qualify it — so each process you digitalize costs less than the one before.
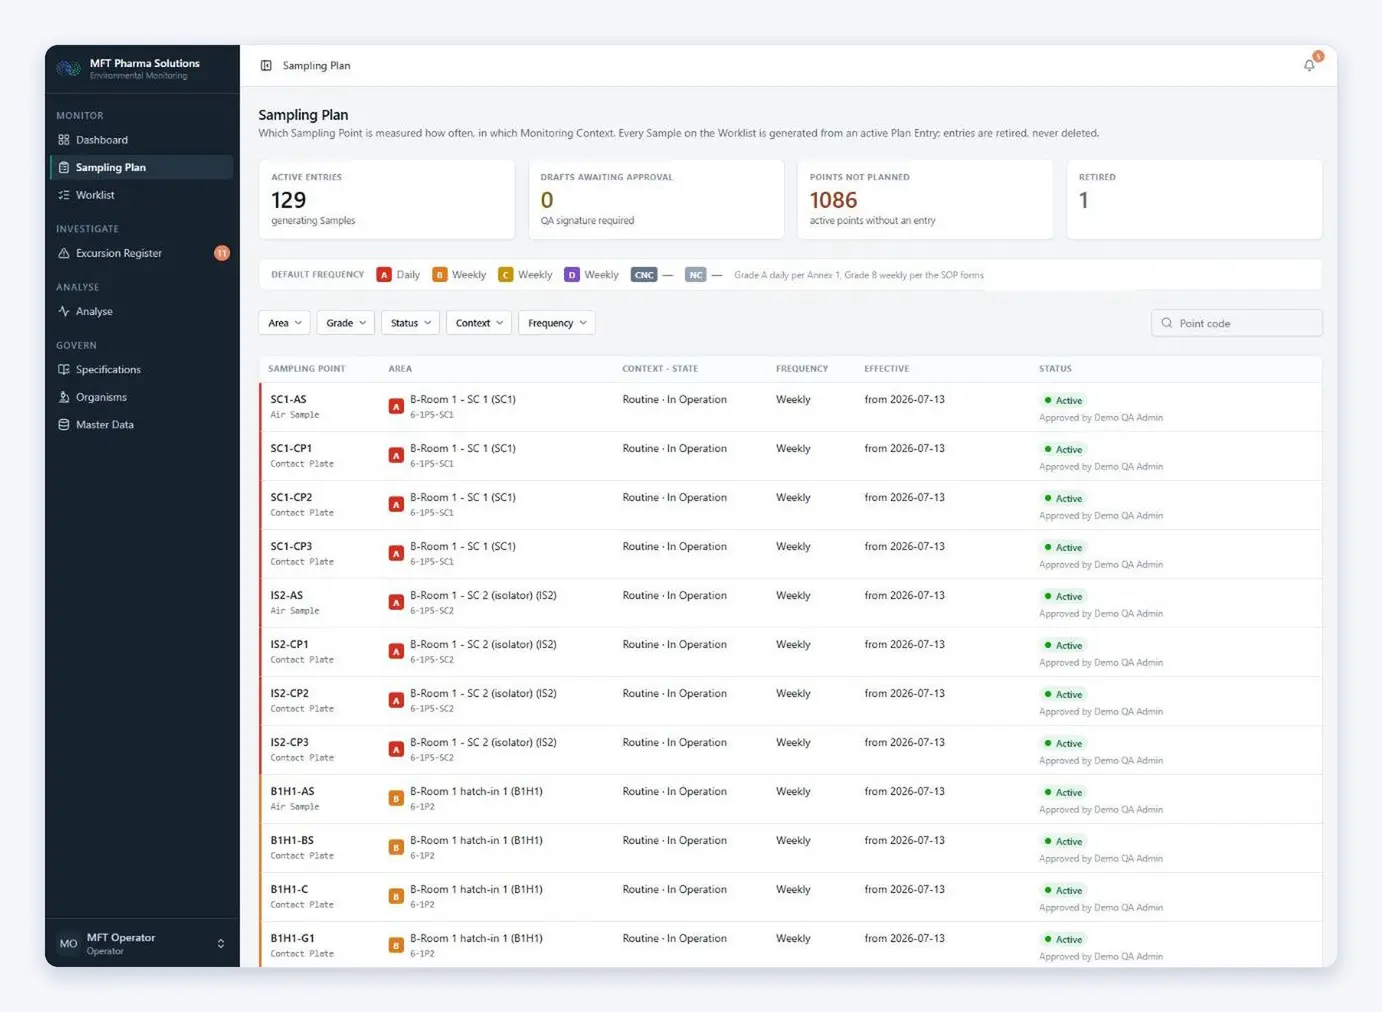
Schedules, records and effectiveness evidence in one governed place.
Due dates, status and certificates tied to the equipment they belong to.
Operator qualification and training records linked to the work performed.
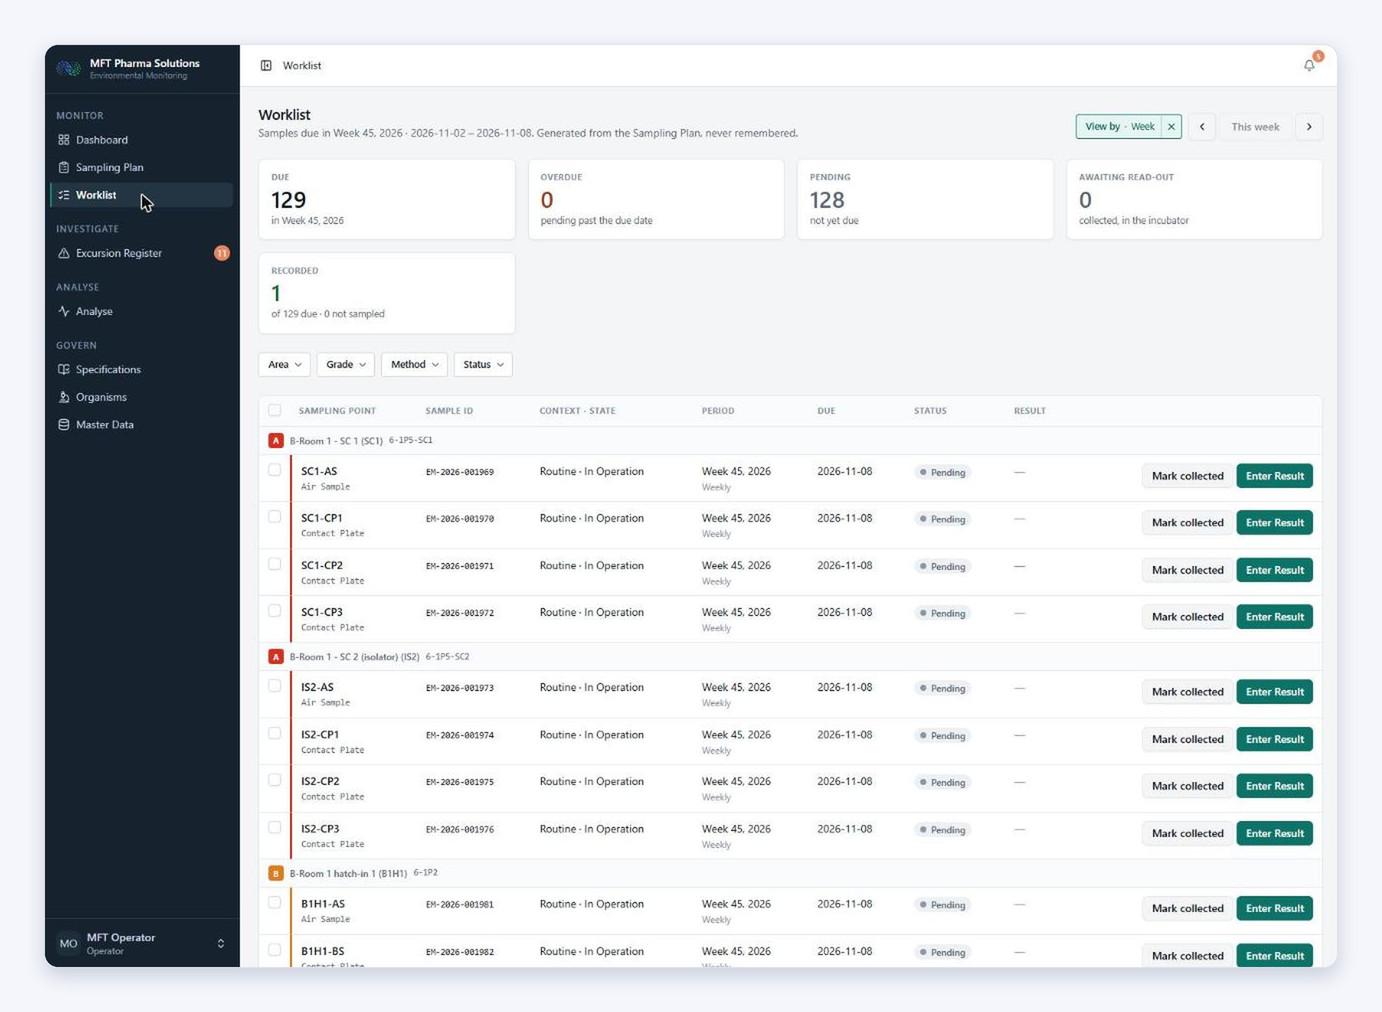
Screens from a live Environmental Monitoring deployment in a cell and gene therapy unit.
The questions quality managers and site leads usually ask us before they start.
No. Smaller sites usually feel the pain first, because one person holds the workbook and the knowledge. The system is configured to the number of rooms and points you actually have, so a small facility pays for a small configuration.
No. The system is configured to reproduce the logic your SOP already defines. Where a rule cannot be reproduced exactly, we flag it to you for a decision rather than silently correcting it.
A first governed version covering master data, sampling plan, data entry, real-time evaluation and the excursion register is delivered in months, not years. Investigation and CAPA workflow, microbial identification and instrument integration follow in later phases.
We deliver it validation-ready and run the qualification with you: URS, risk assessment, IQ, OQ and PQ under GAMP 5, with audit trail and Part 11 verification before release for GMP use.
It is migrated. Your existing result workbooks are cleaned, mapped to the new master data and loaded, so trending and periodic review continue across the cut-over instead of starting again at zero.